Probability Presentation – A Powerful Tool on HowYou Can Manipulate People’s Behavior
There is no doubt that a probability presentation is a powerful tool when it comes to manipulating people’s behavior. By understanding how probabilities can be presented, anyone can use this information to influence people’s decisions. In this blog post, we will discuss how probabilities can be actually displayed and how anyone can use this information to her advantage in order to manipulate our choices.
Percentage vs Frequency – 2 Different Ways of Presenting Probabilities
When it comes to presenting probabilities, there are two main ways this can be done: either as a percentage or as a fraction. For example, the likelihood of winning the lottery can be displayed as either 1% (percentage) or 1 in 100 (frequency) . Both of these ways have their own advantages and disadvantages regarding how we perceive an event to occur.
Percentages are often seen as being more intuitive and easy to understand. However, fractions can sometimes be more accurate, as they account for the total number of possible outcomes.
For example, if there is a 1% chance of winning the lottery, but 100 million people are playing, then the chance of any one person winning is only 1 in 10 million!
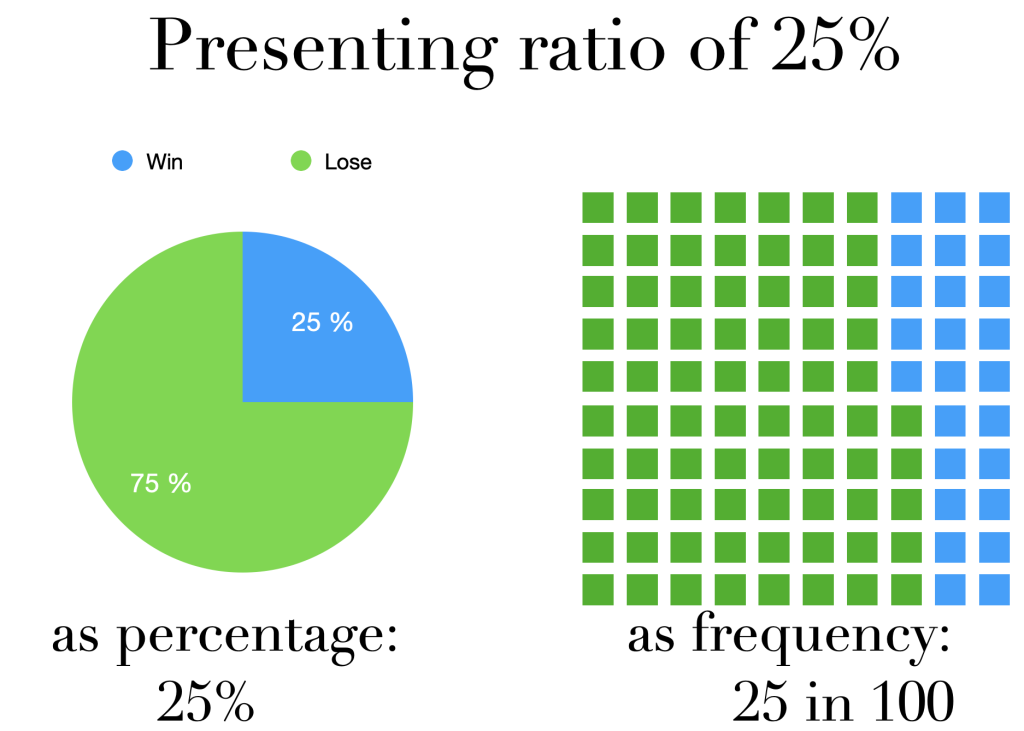
The following image depicts the two ways communicating a change to win of 25%, or 1 in 4:
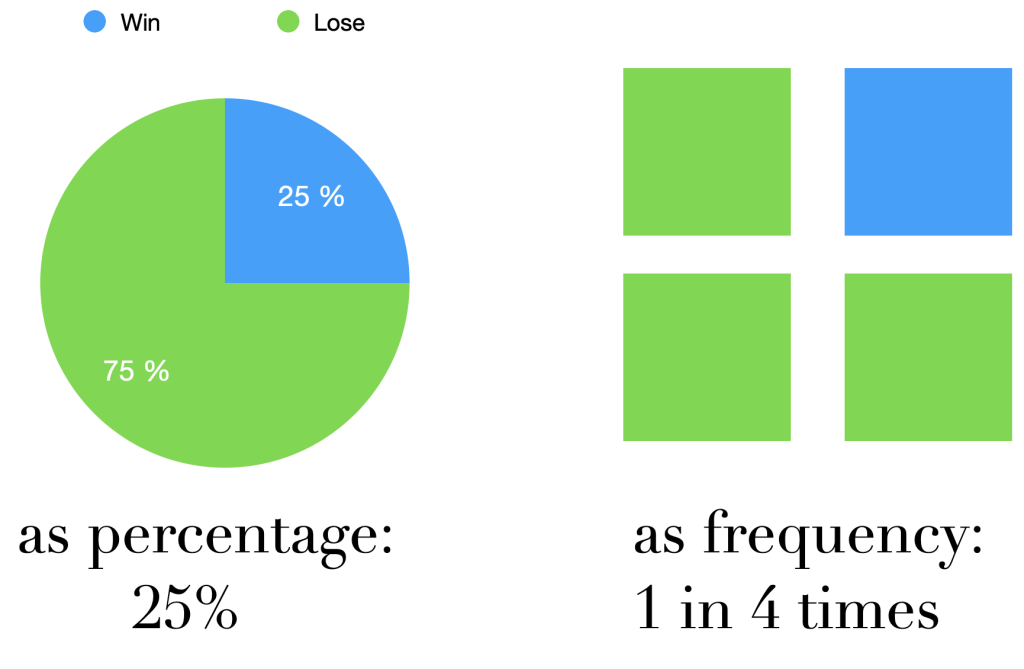
The following image shows how frequencies can still represent the same amount of probability:
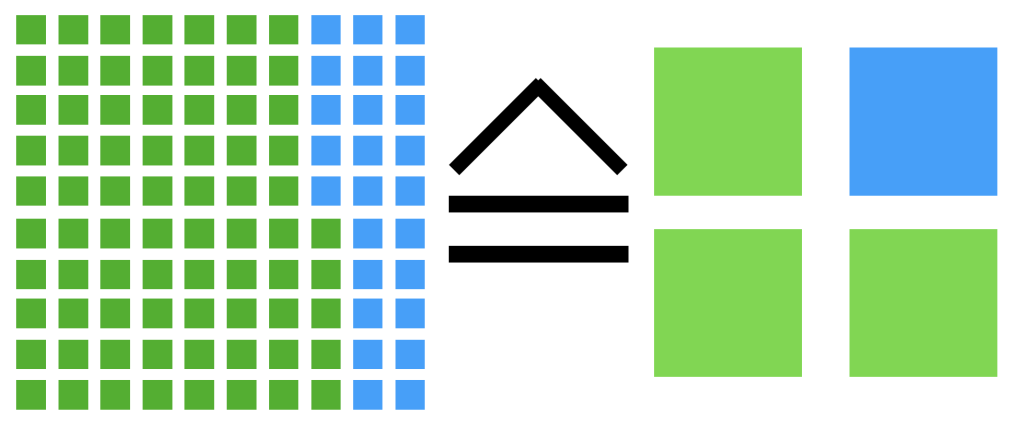
Now, let’s compare the slight manipulation:
Whichever way you choose to display the probability, you need to be aware of the different ways in which people can interpret this information. For example, people tend to underestimate low probabilities and overestimate high probabilities. This is known as the optimistic Bias or the rosy view.
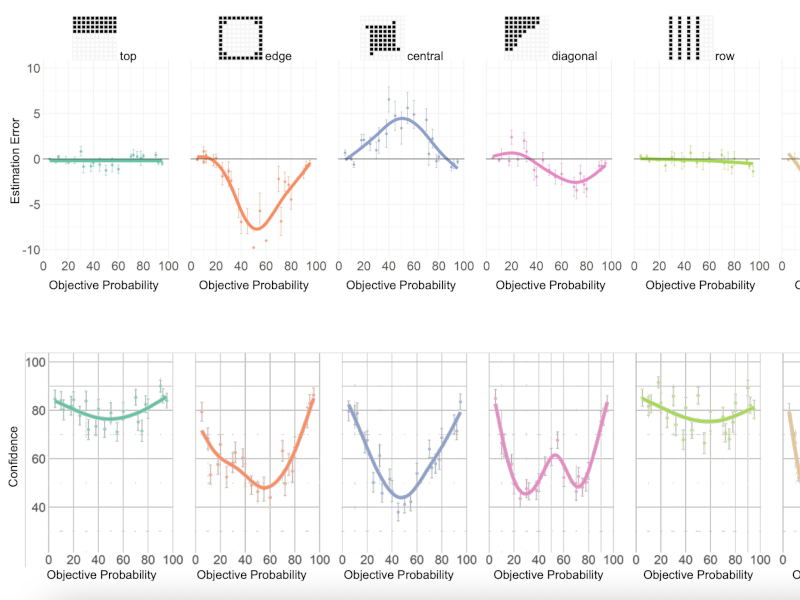
Demiralp et al. (2022): Investigating Perceptual Biases
A Manipulator’s Perspective – Steps in Conducting a Probability Presentation
In general, there are four steps that a manipulator follows when conducting a probability presentation in which each of them can be framed or presented such that it manipulates the reader’s perception:
1) She chooses the event that she wants to calculate the probability for. This could be like winning the lottery or getting into a car accident (Some researchers estimate its value using inconsistent models or inappropriate estimation methods.).
2) She decides on the timeframe that she wants you to consider. This could be for a year, or it could be over a lifetime.
3) She then calculates the probability of the event happening. This can be done using either percentages or fractions:

4) Finally, she presents the information to her audience interestingly and engagingly trying to to take into account the different ways in which people interpret probabilities.
Application of Probability Presentation
She can use this information to her advantage by presenting probabilities to lead people to make the decisions she wants them to make. For example, if she wants people to take a particular action, she could present the probability of success in a more favorable light. Conversely, if she wants people to avoid a particular activity, she could show the probability of failure in a more unfavorable light.
Action in Nudging: Utilizing Probability Presentation
Probability presentation can be utilized in many visual ways using those two types of communication. By understanding how people interpret probabilities, she can use this information to influence their decisions. This can lead to better or worse decision-making, depending on someone’s individual utility. Though, it might improve an outcome when it comes to nudging.
A Policy Maker’s View: Possible Drawbacks of Using Probability Presentation
While there indeed can be some benefits to using probability presentation, there are also some potential drawbacks. If not used correctly, this tool can be misleading and results in bad decisions. A policy maker must understand how probabilities can be presented and how people interpret this information before using it to influence someone’s behavior. Alternatively, she could use other methods of persuasion which don’t involve presenting probabilities.
How Probability Presentation can Cause Bias
How probabilities are presented can cause people to underestimate or overestimate the risks. For example, people tend to underestimate low and high probabilities if a probability is presented as a percentage. This is known as the optimistic Bias or the rosy view.
Conversely, people tend to overestimate low and underestimate high probabilities if a probability is presented as a fraction. This is known as the pessimistic Bias or the glass half-empty view.
These biases can lead to bad decision-making, as people are not accurately assessing the risks involved. It is important that anyone is aware of these biases when reading probabilities, and take them into account in order to not be tricked so easily.
Be cautious when reading papers
Of course, you need to be careful when reading about any probability, as you don’t want to be manipulated in your choice. However, if used in a ethical way, probability presentation can be a powerful tool for influencing people’s behavior. By understanding the different ways in which probabilities can be presented, a policy maker can use this information to a improve society’s outcome overall responsibly (Though, what does responsibly mean when it comes to willingly manipulate someone’s behavior?).
References
Cindy Xiong, Ali Sarvghad, Daniel G Goldstein, Jake M Hofman, and Çagatay Demiralp. 2022. Investigating Perceptual Biases in Icon Arrays. In Proceedings of the 2022 CHI Conference on Human Factors in Computing Systems (CHI ’22). Association for Computing Machinery, New York, NY, USA, Article 137, 1–12. https://doi.org/10.1145/3491102.3501874